
Six water temperature bands, and the gap between them
Contrast sorts water into six bands: Icy below 8 °C, Cold 8–13, Cool 13–20, then Warm 33–38, Hot 38–41 and Very hot above 41. Nothing sits between 20 and 33 °C. Time in each band is counted by giving every reading the seconds until the next one, capped at 15, so a sensor gap cannot inflate a band.
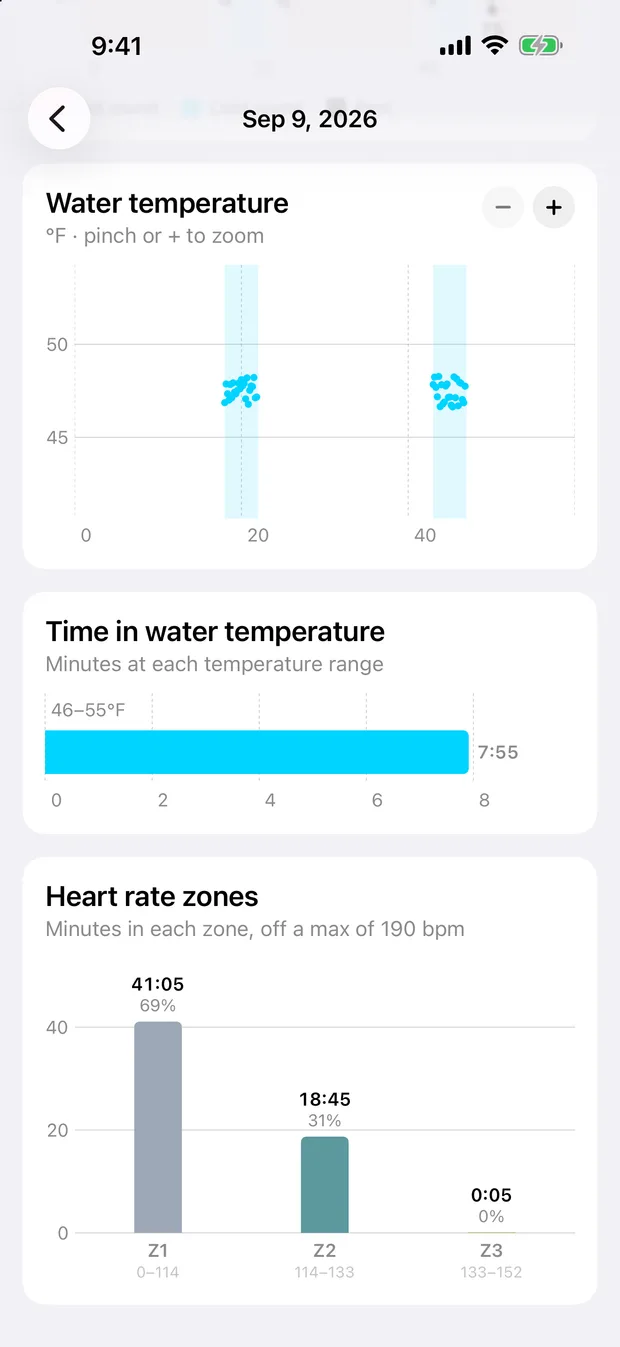
A heart-rate zone chart answers a question you actually have: how much of that was hard? Contrast shows the same shape of answer for water. Six bands, cold to hot, and the minutes you spent in each.
The six bands
| Band | Celsius | Fahrenheit | Phase |
|---|---|---|---|
| Icy | below 8 | below ~46 | Cold |
| Cold | 8–13 | ~46–55 | Cold |
| Cool | 13–20 | ~55–68 | Cold |
| Warm | 33–38 | ~91–100 | Heat |
| Hot | 38–41 | ~100–106 | Heat |
| Very hot | 41 and above | ~106 and up | Heat |
The boundaries live in Celsius and convert for display, so switching units changes the labels and not the buckets.
Three cold bands and three hot ones is not symmetry for its own sake. The cold boundaries fall roughly where the physiology changes: the cold shock response is largest between 10 and 15 °C and below, which puts the interesting line inside the Cold band and below it. The hot boundaries bracket the range the bath research actually used — the eight-week heat therapy trial that improved flow-mediated dilation immersed people at 40.5 °C, which sits in Hot, and the Japanese cohort’s typical tub was around 40 to 42 °C, straddling Hot and Very hot.
The gap, and why it is empty
Nothing occupies 20 to 33 °C. That is a thirteen-degree hole in the middle of the scale, and it is deliberate.
It is the phase classifier’s dead zone. Water at or below 20 °C classifies as cold, water at or above 33 °C classifies as heat, and anything in between does not classify at all — it holds whichever phase is already running and starts nothing new. Giving that range a band would mean inventing a category for readings the app has explicitly declined to categorise.
The source comment puts it plainly: nobody soaks at 26 °C. An ice barrel is 2 to 13. A hot bath is 38 to 42. A swimming pool sits in the gap, and a swimming pool is not contrast therapy.
The gap does move if you move it. Both thresholds are adjustable in settings, so a cool-water swimmer who trains at 22 °C can raise the cold ceiling and have those sessions classify and band correctly.
How the minutes are counted
Each temperature reading owns the time until the next reading arrives, capped at 15 seconds. Add those up per band and you have the time-in-band figures.
The cap is the part that matters. Without it, a sensor that stops reporting for four minutes — which happens, particularly in very cold water — would credit those four minutes to whatever band the last reading fell into. One dropout would put four phantom minutes in Icy. With the cap, that same gap contributes fifteen seconds and the rest of the time is simply not counted.
Under-reporting is the right failure here. A missing minute is a minute you can notice is missing; an invented minute looks exactly like a real one.
For a round still in progress, the last reading is extended to the present moment under the same 15-second cap, so the figure grows as you sit there instead of freezing between samples.
What the bands are used for
Within a session, the temperature page shows the line and the band split, so you can see that a plunge you remember as uniformly brutal was actually 40 seconds of Icy and two minutes of Cold as the water stratified around you.
Across weeks, cold minutes are split by band in the habit section — below 10 °C, 10 to 15, 15 to 20, and 20 or warmer. Those cut points are the ones the cold research uses rather than the six display bands, which is a small inconsistency with a good reason: the display bands are for reading a session, and the analysis bands are for matching a published grouping.
In the adaptation metrics, the band is a gate rather than a display. Cold shock and cold settle only ever compare plunges within a single water band, because how cold the water is changes both the size and the duration of the response. Colder water makes the initial response last longer, which is precisely why pooling a 4 °C plunge with a 16 °C one would produce a trend that was mostly about which barrel you used.
Showers have no band
A shower produces no water reading, so it contributes no time to any band. Its minutes still count towards your weekly heat or cold total, and the app counts them apart where the distinction matters.
This is the one place the band chart can mislead at a glance. A week of daily cold showers and no plunges shows real cold minutes in the weekly totals and an empty band chart, which is correct and looks like a bug the first time you see it.
The sensor’s own ceiling
Apple specifies the water temperature sensor to 40 °C. Very hot, the top band, starts at 41.
Contrast still records above the specification and still bands it, and the app’s own metric documentation says readings up there are less certain. If you take 43 °C baths, treat the Very hot figure as approximately right rather than precisely so, and treat a comparison between two 43 °C baths as shakier than a comparison between two 39 °C ones.
That is the general rule for the whole feature. The bands are a good description of what the sensor saw. What the sensor saw is a wrist, at whatever depth your wrist was, in water that is rarely one temperature throughout.
Common questions
What are the six water temperature bands in Contrast?
Icy below 8 °C, Cold 8–13 °C, Cool 13–20 °C, Warm 33–38 °C, Hot 38–41 °C and Very hot 41 °C and above.
Why is there no band between 20 and 33 °C?
That range is the phase classifier's dead zone. Water there is neither a plunge nor a hot bath, and nobody soaks at 26 °C on purpose, so Contrast leaves it unlabelled rather than inventing a band for it.
How is time in a band calculated?
Each temperature reading owns the time until the next reading, capped at 15 seconds. The cap means a gap in the sensor data cannot inflate a band; a live round's last reading is extended to now under the same cap.
Does the band change if I switch to Fahrenheit?
The boundaries are defined in Celsius and converted for display, so the bands themselves do not move. Icy is below 8 °C, which displays as below about 46 °F.
Sources
- Tipton MJ, Collier N, Massey H, Corbett J, Harper M. Cold water immersion: kill or cure? Experimental Physiology, 2017.
- Šrámek P, Šimečková M, Janský L, Šavlíková J, Vybíral S. Human physiological responses to immersion into water of different temperatures. European Journal of Applied Physiology, 2000.
- Brunt VE, Howard MJ, Francisco MA, Ely BR, Minson CT. Passive heat therapy improves endothelial function, arterial stiffness and blood pressure in sedentary humans. Journal of Physiology, 2016.